The best series for fast bowlers
Australia's fast bowlers averaged 18.35 in the home Ashes. Here's a look at other series where the quick men were utterly dominant
S Rajesh
10-Jan-2014
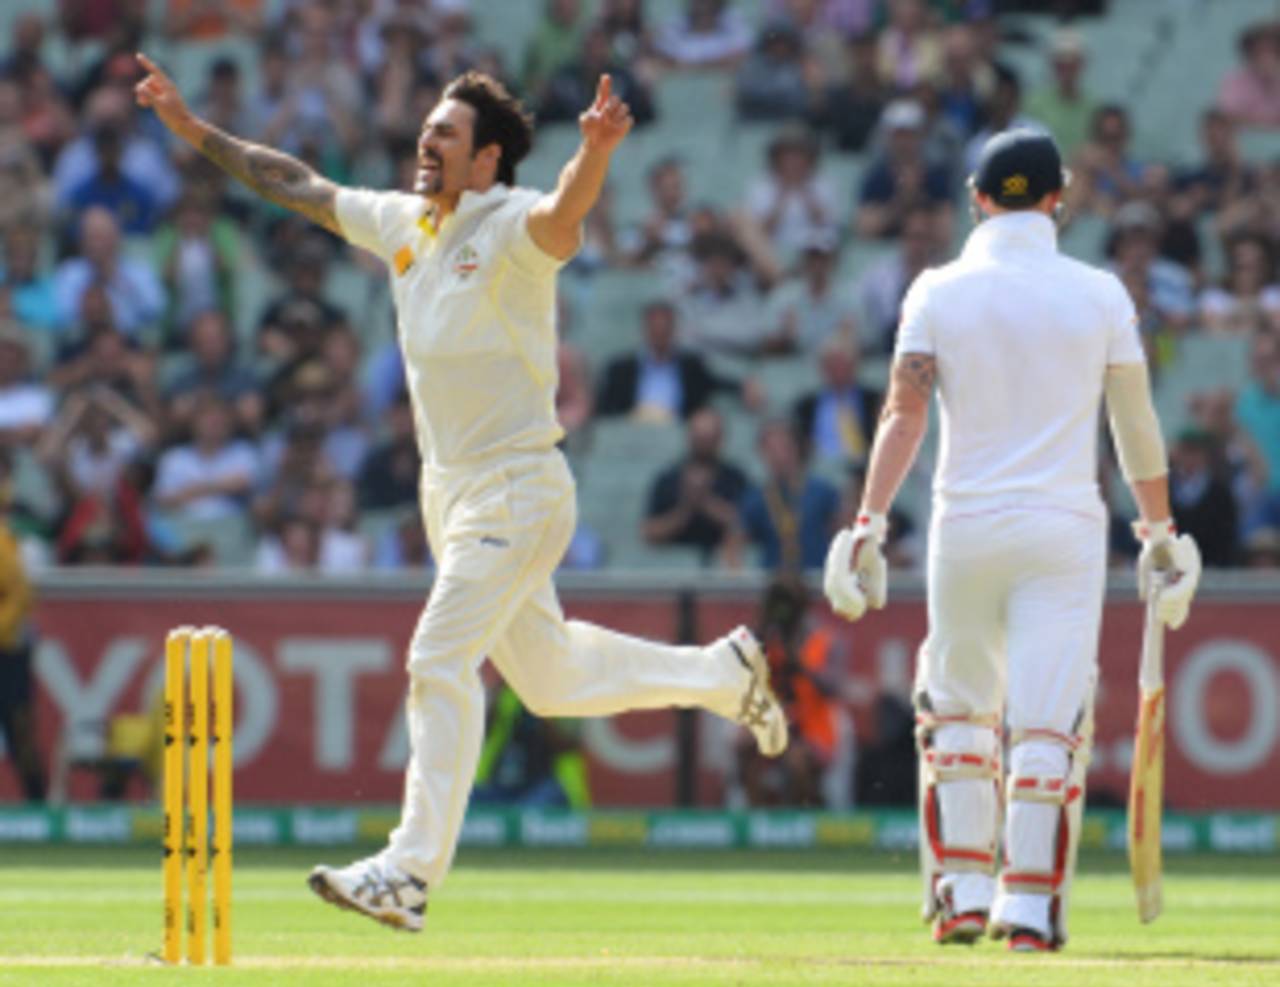
Mitchell Johnson inspired the Australian attack to one of the best performances by a fast-bowling unit in a series since 1970 • AFP
In the recently concluded Ashes series, Australia's fast bowlers took 79 wickets at an average of 18.35. Mitchell Johnson led the way with 37 at a rate of 13.97 each, but the others played a huge role too: Ryan Harris' 22 wickets came at 19.31 each, while Peter Siddle took only 16, but was the most economical of the lot, and averaged 24.12 per wicket. (Click here for Australia's batting and bowling averages in the series.) Overall, it was the best average by a pace attack in an Ashes series since 1890.
These were clearly special numbers put up by the Australian pace attack, and this week's Numbers Game looks at other such great fast-bowling displays in a series of at least four Tests, since1970.
This Ashes performance by Australia is up there among the best ones, but it isn't on top. There are two series of four or more Tests during this period when fast bowlers from a side have done even better. The top performance in the list below remains an Australian one, but not in an Ashes series: against West Indies in the home series in 2000-01 - in what was another 5-0 whitewash - the Australian pace attack took 59 wickets at 17.57. Glenn McGrath led the way with 21 wickets at 17.09 (including a hat-trick in Perth), while Jason Gillespie took 20 at 18.40, and Brett Lee 11 at 16.09. These numbers exclude the contributions from Colin Miller, who took 20 wickets at 18.25, because he also bowled some offspin to go with his medium pace. Add his stats, and Australia's wickets tally goes up to 79, exactly as many as they took in the recent Ashes, at an average of 17.75, still the best by any team during this period.
However, Australia will obviously cherish the Ashes performance more. The West Indies batting line-up of 2000-01 was a feeble one: Brian Lara was the only one to score more than 300 in the series, but even with him, 182 of his 321 runs came in one innings, in Adelaide; in the other nine innings he aggregated 139. The rest of the line-up - Daren Ganga, Sherwin Campbell, Wavell Hinds, Marlon Samuels, Jimmy Adams, and a hopelessly out-of-form Ramnaresh Sarwan - were completely out of their depth against Australia's relentless attack.
The next entry in the list is a more unlikely one: in the 1976-77 tour by England to India, made famous for the Vaseline incident, England's pace attack took 56 wickets at 17.82. (Click here for England's batting and bowling averages in the series.) John Lever's 26 wickets came at 14.61, while Bob Willis took 20 at 16.75.
South Africa's fast bowlers make it twice to the top five, one of them in the last series before they were barred from Test cricket. In their 4-0 rout of Australia in 1969-70, their fast bowlers took 66 wickets at an average of 18.77. Their efforts were led by Mike Procter - 26 wickets at 13.57 - and Peter Pollock - 15 wickets at 17.20. And about 29 years later, Allan Donald and Shaun Pollock were at the forefront of a 5-0 rout of West Indies, with the quick bowlers taking 84 wickets at 18.57. Pollock took 29 at 16.65, Donald 23 at 17.17, and Jacques Kallis 17 at 17.58.
The last two entries in the list below are from the same series - the 1978-79 Ashes in Australia, in which England beat a Packer-weakened Australia 5-1. England's pace attack was led by Willis, Ian Botham, Geoff Miller and Mike Hendrick, and together their fast bowlers took 71 wickets at 20.84. Australia's pace attack was led by Rodney Hogg - he took 41 wickets at 12.85 - with support from Alan Hurst, and their fast bowlers took 75 wickets at 20.89.
| Team | Against | Series | Tests | Wickets | Average | Strike rate |
| Australia | West Indies | in Aus, 2000-01 | 5 | 59 | 17.57 | 43.7 |
| England | India | in Ind, 1976-77 | 5 | 56 | 17.82 | 41.7 |
| Australia | England | in Aus, 2013-14 | 5 | 79 | 18.35 | 42.4 |
| South Africa | West Indies | in SA, 1998-99 | 5 | 84 | 18.57 | 41.4 |
| South Africa | Australia | in SA, 1969-70 | 4 | 66 | 18.77 | 49.6 |
| England | Pakistan | in Eng, 2010 | 4 | 50 | 19.32 | 41.3 |
| West Indies | Pakistan | in Pak, 1980-81 | 4 | 54 | 19.53 | 46.3 |
| West Indies | England | in WI, 1985-86 | 5 | 94 | 19.54 | 37.0 |
| Australia | West Indies | in WI, 1998-99 | 4 | 47 | 19.85 | 46.7 |
| England | India | in Eng, 2011 | 4 | 66 | 20.07 | 42.9 |
| England | West Indies | in Eng, 2000 | 5 | 68 | 20.13 | 44.9 |
| Australia | West Indies | in WI, 1994-95 | 4 | 46 | 20.21 | 41.0 |
| West Indies | England | in Eng, 1988 | 5 | 85 | 20.24 | 49.8 |
| Australia | India | in Aus, 2011-12 | 4 | 71 | 20.45 | 41.2 |
| England | Australia | in Aus, 1978-79 | 6 | 71 | 20.84 | 55.5 |
| Australia | England | in Aus, 1978-79 | 6 | 75 | 20.89 | 66.0 |
In that 1978-79 Ashes, the fast bowlers from both teams combined to take 146 wickets at an average of 20.86, which is one of the best returns for pace attacks from both teams in a series. In a series of four or more Tests since 1970, only once has there been a better series for pace: in 2000, fast bowlers from England and West Indies took a combined total of 138 wickets at an average of 20.78. England's pace attack - led by Dominic Cork, Darren Gough and Andy Caddick - took 68 wickets at 20.13, while the West Indian fast bowlers - led by Curtly Ambrose and Courtney Walsh - took 70 at 21.42. England had much the better of the series, though, winning 3-1.
England were similarly dominant against Pakistan at home in 2010, winning that series 3-1 as well. Their pace attack of James Anderson, Stuart Broad and Steven Finn averaged 19.32. Pakistan's pace attack wasn't quite as venomous, averaging only 26 runs per wicket, but the combined pace average for the series was still 22.40.
There's another Ashes series a little further down the list too - the famous 1981 one, in which the two pace attacks collectively took 194 wickets in six Tests at 23.72. England won that series 3-1, but there was little to choose between the pace attacks of the two teams: Australia's took 102 wickets at 23.86, while England's pace bowlers averaged 23.56 for their 92 wickets.
The entries in the table below are littered with series played in the late 1980s, 1990s, or 2000, which illustrates how strong fast bowling was worldwide during that period.
| Series | Tests | Wickets | Average | Strike rate |
| West Indies in England, 2000 | 5 | 138 | 20.78 | 48.5 |
| The Ashes, 1978-79 | 6 | 146 | 20.86 | 60.9 |
| Pakistan in England, 2010 | 4 | 93 | 22.40 | 46.5 |
| Australia in West Indies, 1994-95 | 4 | 98 | 23.15 | 46.1 |
| India in West Indies, 1988-89 | 4 | 84 | 23.55 | 50.9 |
| West Indies in South Africa, 1998-99 | 5 | 148 | 23.56 | 49.0 |
| The Ashes, 1981 | 6 | 194 | 23.72 | 53.0 |
| Australia in West Indies, 1998-99 | 4 | 104 | 24.00 | 54.9 |
| New Zealand in England , 1999 | 4 | 92 | 24.21 | 54.6 |
| England in West Indies, 1997-98 | 6 | 123 | 24.64 | 56.9 |
And finally, a look at the fast bowlers who've achieved the best averages in a series since 1970 (with a 30-wicket cut-off). Johnson is in sixth place, but less than two runs separate his average from that of Richard Hadlee, who leads the table with an average of 12.15 for his 33 wickets from just three Tests against Australia in 1985-86. The next two in the list are both by West Indian bowlers in England - by Marshall in 1988, when he took 35 wickets at 12.65, and Walsh in 2000, when his 34 wickets came at 12.82 each.
The other bowlers above Johnson are Hogg - in that 1978-79 Ashes - and Imran Khan - against India in 1982-83, when he took 40 wickets at 13.95. Despite that heroic effort by Imran, the overall average for Pakistan's pace attack in that series was only 27.02, because the rest of the fast bowlers struggled for wickets.
Ambrose and McGrath both feature twice in the top 12, which shows just how unstoppable they could be once they got on top of a batting line-up.
| Bowler | Series | Tests | Wickets | Average | Strike rate |
| Richard Hadlee | v Aus, 1985-86 | 3 | 33 | 12.15 | 30.8 |
| Malcolm Marshall | v Eng, 1988 | 5 | 35 | 12.65 | 34.8 |
| Courtney Walsh | v Eng, 2000 | 5 | 34 | 12.82 | 38.8 |
| Rodney Hogg | v Eng, 1978-79 | 6 | 41 | 12.85 | 42.4 |
| Imran Khan | v Ind, 1982-83 | 6 | 40 | 13.95 | 33.4 |
| Mitchell Johnson | v Eng, 2012-13 | 5 | 37 | 13.97 | 30.5 |
| Curtly Ambrose | v Eng, 1997-98 | 6 | 30 | 14.26 | 41.1 |
| Curtly Ambrose | v Aus, 1992-93 | 5 | 33 | 16.42 | 47.3 |
| Joel Garner | v Aus, 1983-84 | 5 | 31 | 16.87 | 40.4 |
| Glenn McGrath | v WI, 1998-99 | 4 | 30 | 16.93 | 39.9 |
| Glenn McGrath | v Eng, 2001 | 5 | 32 | 16.93 | 36.4 |
| Terry Alderman | v Eng, 1989 | 6 | 41 | 17.36 | 39.4 |
S Rajesh is stats editor of ESPNcricinfo. Follow him on Twitter